


The main difference between Bearish Harami and Bearish Engulfing pattern lies in their structure and market signals. A Bearish Harami forms when a small candlestick appears inside the previous day’s larger bullish candle. A Bearish Engulfing engulfs the prior bullish candle, signaling strong selling pressure.
Contents:
- Bearish Harami Meaning
- Bearish Engulfing Meaning
- Difference Between Bearish Harami and Bearish Engulfing Pattern
- How to Identify a Bearish Harami Pattern?
- How to Identify a Bullish Engulfing Pattern?
- Difference Between Bearish Harami and Bearish Engulfing Pattern – Quick Summary
- Bearish Harami vs Bearish Engulfing Pattern – FAQ
Bearish Harami Meaning
A Bearish Harami is a two-candlestick pattern that signals a potential reversal in an uptrend. It forms when a small bearish candle appears inside the previous day’s larger bullish candle. This pattern indicates weakening buying pressure and suggests a possible shift toward bearish momentum.
The Bearish Harami pattern shows indecision in the market. Buyers struggle to push prices higher, and sellers begin gaining control. The small bearish candle within the bullish candle reflects hesitation. Traders often look for confirmation, like a further price drop, before acting. It is more effective near resistance levels or after a prolonged uptrend. When followed by increased selling pressure, it strengthens the bearish signal. This pattern works best when combined with other technical indicators, such as volume analysis or moving averages, to validate the trend reversal.


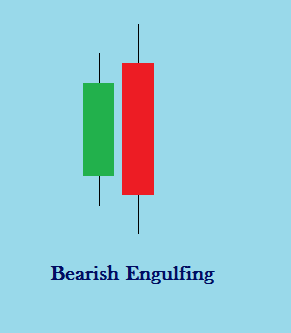
Bearish Engulfing Meaning
A Bearish Engulfing pattern is a two-candlestick formation that indicates a potential reversal in an uptrend. It occurs when a larger bearish candle completely engulfs the previous day’s smaller bullish candle. This pattern signals a strong shift from buying to selling pressure.
The Bearish Engulfing pattern reveals a decisive change in market sentiment. It begins with buyers pushing the price higher, reflected in the initial bullish candle. The next day, sellers dominate, creating a large bearish candle that engulfs the previous one. This shift suggests growing bearish momentum and the possibility of a trend reversal. Traders often use this pattern alongside volume analysis to confirm its strength. It is most reliable at the top of an uptrend or near resistance levels, highlighting a significant bearish signal that prompts cautious trading or short positions.
Difference Between Bearish Harami and Bearish Engulfing Pattern
The fundamental differences between the Bearish Harami and Bearish Engulfing pattern lie in their structure and market signals. A Bearish Harami has a small bearish candle inside a larger bullish candle, showing indecision. A Bearish Engulfing pattern fully engulfs the previous bullish candle, signaling strong selling pressure and a potential reversal.
| Parameter | Bearish Harami | Bearish Engulfing |
| Structure | A small bearish candle forms within a larger bullish candle. | A large bearish candle completely engulfs the previous bullish candle. |
| Market Signal | Indicates hesitation and a potential trend reversal. | Suggests a strong bearish reversal with increased selling pressure. |
| Strength of Reversal | Moderate, needs confirmation from other indicators. | Strong, often leading to a downward trend. |
| Trend Relevance | More effective after an uptrend or near resistance levels. | Best when appearing after a strong uptrend. |
| Trader Interpretation | Seen as an early warning of bearish momentum. | A decisive bearish signal with clear dominance of sellers. |
| Confirmation Needed | Requires further bearish confirmation like a price drop. | Less confirmation needed due to strong selling dominance. |
| Reliability | Works best with additional indicators like volume or trendlines. | Considered a reliable reversal pattern, especially with high trading volume. |
| Candle Relationship | The second candle remains within the range of the first candle. | The second candle fully engulfs the first, covering its high and low. |
How to Identify a Bearish Harami Pattern?
The main way to identify a Bearish Harami pattern is by looking for a two-candlestick formation during an uptrend. The first candle is large and bullish, followed by a smaller bearish candle within its range. This pattern suggests weakening buying pressure and a possible reversal.
- Look for an Existing Uptrend: A Bearish Harami appears after a price rise. It signals a potential reversal when buyers start losing control. Traders must confirm that the pattern forms after a steady uptrend. Without a prior upward movement, the pattern lacks significance and may not indicate a trend change.
- Observe the First Candlestick: The first candle in a Bearish Harami is always large and bullish. It represents strong buying momentum. This candle is crucial because it sets the context for the pattern. If the preceding candle is not bullish, the formation does not qualify as a Bearish Harami.
- Check the Second Candlestick: The second candle is much smaller and bearish. It must remain within the high and low range of the first candle. This size difference shows hesitation among buyers. A small bearish candle after a strong bullish one indicates reduced buying interest and potential selling pressure.
- Confirm the Pattern with Volume: A Bearish Harami with decreasing volume strengthens the reversal signal. Lower volume on the second candle suggests weak buying support. If the volume increases on a bearish breakout after the pattern, it confirms that sellers are taking control and the trend is shifting downward.
- Analyze the Market Context: The pattern is more reliable near resistance levels or after a long rally. If the market is already showing signs of exhaustion, the Bearish Harami becomes a stronger bearish indicator. Traders should also consider broader market trends and sentiment before making decisions.
- Look for Additional Confirmation: A Bearish Harami alone does not guarantee a reversal. Traders should wait for further bearish signals like a breakdown below support or a follow-up bearish candle. Using technical indicators like RSI or moving averages can help validate the pattern’s strength.
How to Identify a Bullish Engulfing Pattern?
The primary way to identify a Bullish Engulfing pattern is by spotting a two-candlestick formation in a downtrend. The first candle is small and bearish, while the second is a larger bullish candle that completely engulfs the previous one. This signals strong buying momentum.
- Ensure a Prior Downtrend Exists: A Bullish Engulfing pattern forms only after a sustained price decline. It signals that buyers are gaining control. If the pattern appears without a prior downtrend, it lacks significance. Traders should confirm that the market was in a bearish phase before relying on the signal.
- Observe the First Candlestick: The first candle is always bearish and relatively small. It represents weak selling pressure. This candle is important because it sets the stage for the reversal. If the initial candle is not clearly bearish, the pattern may not indicate a strong buying comeback.
- Analyze the Second Candlestick: The second candle is large and bullish. It fully engulfs the first bearish candle’s body, showing a sudden shift in market sentiment. A strong bullish candle means buyers have overpowered sellers. The bigger the engulfing candle, the stronger the reversal signal.
- Check Volume for Confirmation: A valid Bullish Engulfing pattern often appears with rising volume. Higher volume during the bullish candle suggests strong buying interest. If volume remains low, the pattern may not hold strength. Traders should watch for increased participation to confirm the shift in momentum.
- Consider the Market Context: The pattern is more effective near support levels or after an extended downtrend. If it forms in a neutral or sideways market, it may not indicate a strong reversal. Traders should also assess overall market sentiment before making trading decisions.
- Wait for Additional Confirmation: A single candlestick pattern does not confirm a trend reversal. Traders should wait for follow-through buying in the next sessions. Additional indicators like RSI divergence or moving averages can provide stronger confirmation. A breakout above resistance strengthens the pattern’s reliability.
Difference Between Bearish Harami and Bearish Engulfing Pattern – Quick Summary
- The main difference between the Bearish Harami and Bearish Engulfing pattern lies in their structure and market signals. A Bearish Harami has a small bearish candle inside a bullish one, showing indecision, while a Bearish Engulfing fully engulfs the prior bullish candle, signaling strong selling pressure.
- A Bearish Harami is a two-candlestick pattern that signals a possible reversal. It forms when a small bearish candle appears within the range of a larger bullish candle. This indicates a decline in buying pressure and hints at a potential shift toward bearish momentum.
- The primary meaning of a Bearish Engulfing pattern is that it indicates a strong bearish reversal. A large bearish candle completely engulfs the previous bullish candle, showing that sellers have taken control and the trend may shift downward.
- The key difference between a Bearish Harami and Bearish Engulfing pattern is their strength and formation. A Bearish Harami shows hesitation and requires further confirmation, while a Bearish Engulfing is a stronger bearish signal that often results in immediate selling pressure.
- The main way to identify a Bearish Harami is by spotting a two-candlestick pattern during an uptrend. The first candle is large and bullish, while the second is smaller and bearish, fitting within the first candle’s range, signaling weakening buying momentum and possible selling pressure.
- A Bullish Engulfing pattern forms in a downtrend when a small bearish candle is followed by a larger bullish candle that fully engulfs it. This shift signals that buyers have regained control, increasing the chances of a trend reversal and upward movement in price.
- Want to improve your trading strategy with better market insights? Alice Blue Online offers advanced trading tools, expert analysis, and real-time market updates to help you make informed decisions. Start trading with confidence today!

Bearish Harami vs Bearish Engulfing Pattern – FAQ
The main difference is in their formation and strength. A Bearish Harami has a small bearish candle inside a bullish one, signaling indecision, while a Bearish Engulfing fully engulfs the previous bullish candle, indicating strong selling pressure and reversal.
A Bearish Harami is a two-candlestick pattern that forms during an uptrend. The first candle is large and bullish, while the second is a smaller bearish candle within its range, signaling potential weakness and a trend reversal.
A Bearish Engulfing pattern forms when a large bearish candle completely engulfs the previous bullish candle. It signals a strong shift in market sentiment, showing that sellers have gained control and a downward trend may follow.
A Bearish Harami indicates weakening buying momentum and potential trend reversal. It suggests that sellers are gaining control, but confirmation from further price movement or technical indicators is needed before making trading decisions.
The Bearish Harami is moderately accurate and needs confirmation. Alone, it signals indecision rather than a strong reversal. Traders use additional indicators like volume analysis or moving averages to improve its reliability.
The Bearish Engulfing pattern is highly reliable when it appears after a strong uptrend. It signals strong selling pressure and trend reversal, especially if accompanied by high volume and other technical confirmations.
The primary confirmation of a Bearish Engulfing pattern is a price drop in the following sessions. Increased volume, a break below support, or additional bearish indicators strengthen the reversal signal.


