


The main difference between the bullish harami and bullish engulfing patterns lies in their formation. A bullish harami indicates a potential reversal with a smaller second candle, while a bullish engulfing shows strong buyer momentum with the second candle completely covering the first.
Contents:
- Bullish Harami Meaning
- Bullish Engulfing Meaning
- Difference Between Bullish Harami and Bullish Engulfing Pattern
- How to Identify a Bullish Harami Pattern?
- How to Identify a Bullish Engulfing Pattern?
- Difference Between Bullish Harami and Bullish Engulfing Pattern – Quick Summary
- Bullish Harami vs Bullish Engulfing Pattern – FAQ
Bullish Harami Meaning
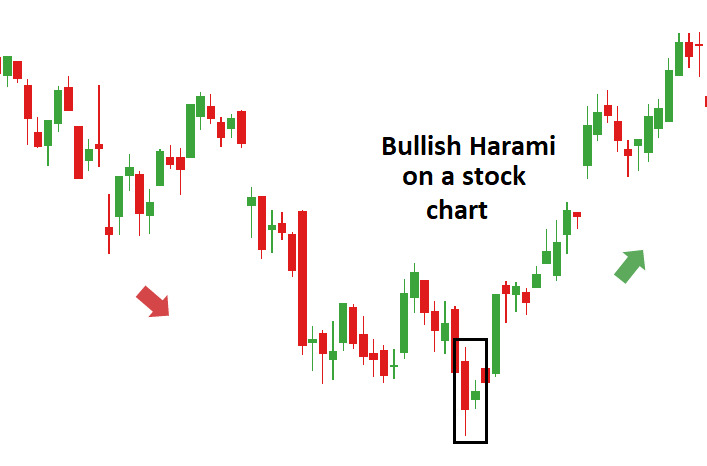
A bullish harami is a two-candlestick pattern that signals a potential reversal in a downward trend. The first candle is large and bearish, while the second is smaller and bullish, forming within the previous candle’s body. This indicates weakening selling pressure.
The bullish harami suggests that sellers are losing control, and buyers may gain momentum. It often appears at the bottom of a downtrend, signaling a potential upward reversal. Traders use this pattern in combination with other technical indicators to confirm the trend. It serves as an early warning for market sentiment shifts and is widely used in stocks, forex, and commodity markets. Proper analysis of volume and other patterns enhances its reliability.

Bullish Engulfing Meaning
A bullish engulfing is a two-candlestick pattern that signals a potential reversal in a downtrend. The second candle is larger and bullish, fully engulfing the first bearish candle. This shows strong buyer momentum, increased market confidence, and a likely trend change upward.
The bullish engulfing pattern appears when buyers overpower sellers, shifting market sentiment. It forms at the bottom of a downward trend and often signals the start of an upward movement. Traders consider it a strong reversal signal, especially when accompanied by high trading volume. This pattern is common in stocks, forex, and commodities markets. Combining it with other technical tools like support levels or RSI helps improve reliability and confirm potential upward trends.

Difference Between Bullish Harami and Bullish Engulfing Pattern
The primary difference between bullish harami and bullish engulfing patterns lies in their formation. A bullish harami has a smaller bullish candle within the body of a larger bearish candle, while a bullish engulfing features a large bullish candle completely covering a smaller bearish candle.
| Parameter | Bullish Harami | Bullish Engulfing |
| Formation | A small bullish candle forms within the body of a larger bearish candle. | A large bullish candle completely engulfs the body of a smaller bearish candle. |
| Signal Strength | Indicates a potential reversal but with moderate confirmation of trend change. | Suggests a strong reversal and robust confirmation of buyer dominance. |
| Market Sentiment | Reflects weakening selling pressure and initial signs of buyer interest. | Indicates a powerful shift to buyer control and increased optimism in the market. |
| Appearance | Second candle is smaller and does not surpass the first candle’s range. | Second candle is larger and fully overtakes the range of the first candle. |
| Reliability | Requires additional confirmation from volume or other indicators for accuracy. | Considered a stronger signal and often reliable on its own with less confirmation. |
| Occurrence | Found during the late stages of a downtrend, signalling a potential reversal. | Typically, it appears at the end of a downtrend, marking a decisive reversal. |
| Trading Strategy | Traders use cautiously, combining with other indicators for confirmation. | Traders often act quickly due to its strong reversal indication and high reliability. |
How to Identify a Bullish Harami Pattern?
The ideal way to identify a bullish harami pattern is by spotting two candlesticks where the second, smaller bullish candle forms entirely within the body of the previous larger bearish candle. This indicates weakening selling pressure and a potential upward price reversal.
- First Candle Characteristics: The first candle is large and bearish, representing strong selling pressure. It highlights a dominant downtrend and suggests that sellers were in control during the trading session. This candle sets the stage for the second, smaller bullish candle to indicate a potential shift in sentiment.
- Second Candle Formation: The second candle is smaller and bullish, forming within the body of the previous bearish candle. This indicates seller hesitation and growing buyer activity. It acts as a critical signal of market indecision and a potential shift toward upward price movement in the near term.
- Market Context: The bullish harami pattern typically forms during a downtrend and suggests weakening bearish momentum. It signals that selling pressure is fading, and buyers are stepping in. This pattern is often an early indication of a trend reversal when supported by other market conditions or technical signals.
- Volume Analysis: Higher trading volume accompanying the second bullish candle strengthens the reliability of the bullish harami pattern. Increased volume confirms active buyer participation and raises the probability of a trend reversal. Traders consider volume analysis essential for validating the effectiveness of this pattern.
- Confirmation Indicators: Using confirmation tools like support levels, moving averages, or oscillators ensures the bullish harami pattern’s reliability. Without validation, the pattern may provide false signals. Confirming market behavior improves confidence in trading decisions and reduces the risk of unexpected price reversals.
- Timeframe Consideration: The pattern can appear on multiple timeframes, but it becomes more reliable on higher ones like daily or weekly charts. Higher timeframes reduce market noise, providing a clearer and more accurate representation of market trends, making it a stronger signal for traders.
How to Identify a Bullish Engulfing Pattern?
The best way to identify a bullish engulfing pattern is by observing a larger bullish candle that completely engulfs the previous smaller bearish candle. It forms during a downtrend, signaling strong buyer momentum and a potential reversal toward upward price movement.
- First Candle Characteristics: The first candle is bearish and small, indicating continued selling pressure in a downward trend. This candle reflects seller dominance and sets the stage for the next session. Its size and position within the pattern are crucial for identifying the engulfing structure.
- Second Candle Formation: The second candle is bullish and larger, fully engulfing the body of the first bearish candle. This indicates strong buying activity overpowering sellers. The complete coverage of the first candle’s range signals a significant shift in market sentiment toward the buyers.
- Volume Confirmation: High trading volume during the second candle adds strength to the bullish engulfing pattern. Increased volume indicates significant buyer activity and validates the likelihood of a trend reversal. Traders rely on this confirmation to confidently use the pattern as a signal for market entry.
- Market Context: The bullish engulfing pattern forms at the end of a downtrend, signaling a potential reversal. It shows sellers losing dominance and buyers gaining control. This pattern often suggests a shift in market sentiment, encouraging traders to anticipate upward price movements and consider long positions.
- Timeframe Impact: The pattern is more reliable on higher timeframes such as daily or weekly charts. These timeframes reduce market noise, offering a clearer trend perspective. Shorter timeframes may produce false signals, making higher timeframes ideal for accurate pattern identification and decision-making.
- Trading Strategy: Traders often use bullish engulfing patterns to initiate long positions. Combining this pattern with other technical tools like support levels or moving averages ensures better accuracy. Using additional analysis helps validate the pattern and minimizes the risk of acting on false signals.
Difference Between Bullish Harami and Bullish Engulfing Pattern – Quick Summary
- The main difference between bullish harami and bullish engulfing patterns lies in their formation. A harami has a smaller bullish candle within a larger bearish candle, while an engulfing shows the bullish candle fully overtaking the bearish one.
- The primary meaning of a bullish harami is a two-candlestick pattern where the smaller bullish candle forms within the larger bearish candle, signaling weakening selling pressure and a potential reversal.
- The key characteristic of a bullish engulfing pattern is a larger bullish candle that fully engulfs a smaller bearish candle, indicating strong buyer momentum and a likely upward trend reversal.
- The main difference between the two patterns is their signal strength. Bullish engulfing provides a stronger indication of reversal, while bullish harami suggests a moderate trend change requiring further confirmation.
- The ideal way to identify a bullish harami pattern is by spotting two candles: a smaller bullish candle forming entirely within the body of a larger bearish candle during a downtrend.
- The best way to identify a bullish engulfing pattern is by observing a larger bullish candle that fully engulfs a smaller bearish candle, forming at the bottom of a downtrend to signal a reversal.
- Learn to analyze patterns like bullish harami and bullish engulfing effectively with Alice Blue Online. Gain access to advanced charting tools, insights, and resources to improve your trading strategies today.

Bullish Harami vs Bullish Engulfing Pattern – FAQ
The primary difference is that a bullish harami has a smaller bullish candle within a bearish candle, while bullish engulfing features a larger bullish candle fully engulfing the bearish one, signaling stronger reversal momentum.
A bullish harami is a two-candlestick pattern where a smaller bullish candle forms within a larger bearish candle. It indicates weakening selling pressure and hints at a potential market reversal.
A bullish engulfing is a pattern where a larger bullish candle completely engulfs a smaller bearish candle. It signifies strong buyer momentum and indicates a potential upward trend reversal in the market.
The bullish harami is moderately reliable and oftentimes it requires confirmation through volume or other indicators. It signals a potential reversal but should not be solely relied upon for decisions.
After a bullish pattern, the market often experiences upward momentum. This indicates increasing buyer activity, signaling a potential price rise and a shift in the sentiment from bearish to bullish.
After a harami candle, the market may show signs of reversal if supported by confirmation signals. It reflects weakening seller momentum, with buyers starting to gain control of the market.
Bullish engulfing is a strong buy signal that shows buyers overtaking sellers. It suggests a potential price increase and indicates a shift in market sentiment from bearish to bullish, marking a likely trend reversal.


