


The main difference between bullish and bearish lies in market sentiment. A bullish market reflects optimism and rising prices, while a bearish market signals pessimism and falling prices. These terms represent opposite trends that shape investor decisions and overall market behavior.
Contents:
What Is Bullish Candlestick?
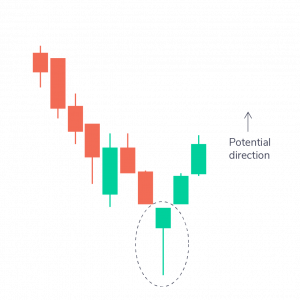
A bullish candlestick shows that the price of a financial asset has increased during a trading session. It represents buyer dominance and indicates market optimism. These candlesticks are crucial for analyzing price trends and identifying potential upward movements in the market.
A bullish candlestick forms when the closing price is higher than the opening price. It typically has a long body, reflecting strong buying pressure. The color of the candlestick, often green or white, helps traders quickly recognize bullish patterns. Some of the common examples of Bullish Candlestick include the hammer, engulfing, and morning star patterns. These patterns guide traders in predicting potential reversals or continuations of upward trends. Proper analysis of these candlesticks supports better decision-making in stock, forex, or cryptocurrency trading.

What Is Bearish Candlestick?
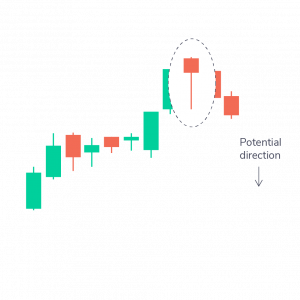
A bearish candlestick shows that the price of a financial asset has decreased during a trading session. It indicates seller dominance and reflects the market pessimism. These candlesticks help traders identify potential downward trends or reversals in price movements effectively.
A bearish candlestick forms when the closing price is lower than the opening price. It usually has a long body, signifying strong selling pressure. The candlestick is typically red or black, making it easy to distinguish. Some of the primary examples of Bearish Candlestick are patterns like the shooting star, bearish engulfing, and evening star. These patterns highlight potential downward price shifts and signal selling opportunities. Traders use bearish candlesticks for technical analysis in stocks, forex, and other markets. Understanding these candlesticks helps in making better trading decisions and managing risk effectively.
Bullish Vs Bearish Candlestick Patterns
The primary difference between bullish and bearish candlestick patterns lies in their market indication. Bullish patterns suggest a potential price increase driven by strong buying pressure. In contrast, bearish patterns signify a possible price decrease caused by dominant selling activity in the market.
| Parameter | Bullish Candlestick Patterns | Bearish Candlestick Patterns |
| Market Sentiment | Reflects optimism and confidence among buyers, indicating potential upward price movements. | Reflects pessimism and dominance of sellers, suggesting potential downward price trends. |
| Price Movement | Closing price is consistently higher than the opening price, confirming buyer strength. | Closing price is consistently lower than the opening price, highlighting seller dominance. |
| Color | Represented by green or white candlesticks for easy recognition of bullish trends. | Represented by red or black candlesticks to indicate bearish trends visually. |
| Signal | Indicates buying opportunities or the continuation of an upward trend. | Suggests selling opportunities or the likelihood of a downward trend. |
| Common Patterns | Examples include Hammer, Bullish Engulfing, Morning Star, and Piercing Line patterns. | Examples include Shooting Star, Bearish Engulfing, Evening Star, and Dark Cloud Cover patterns. |
| Body Size | A long body signifies strong buying pressure and confidence in price increase. | A long body indicates strong selling pressure and confidence in price decrease. |
| Shadows/Wicks | Short lower shadows often indicate strong upward momentum, with buyers firmly in control. | Long upper shadows suggest rejection of higher prices, with sellers dominating the session. |
| Implication | Encourages traders to take buying positions, predicting potential profit from rising prices. | Signals traders to take selling positions or hedge against potential losses. |
Advantage And Disadvantage Of Bullish And Bearish
The fundamental advantage of bullish and bearish candlestick patterns is their ability to visually indicate market sentiment and price trends. However, their primary disadvantage lies in their susceptibility to false signals, especially during highly volatile or news-driven market conditions, leading to potential misinterpretations.
Advantages
- Visual Simplicity: Bullish and bearish candlestick patterns provide clear visual cues for identifying price trends, making them straightforward to interpret. They allow traders to assess market sentiment quickly and simplify decision-making. Both beginners and experienced traders can use these patterns effectively without needing complex analytical tools or indicators.
- Trend Prediction: Candlestick patterns help traders predict trend reversals or continuations, supporting profitable decision-making. Patterns like bullish engulfing or bearish shooting star highlight potential opportunities for entry and exit. By analyzing these patterns, traders can time their moves accurately and enhance their chances of successful trades in dynamic markets.
- Wide Applicability: These patterns work seamlessly across various financial markets, including stocks, forex, and commodities. Their versatility ensures traders can apply them to different asset classes with consistent accuracy. This makes candlestick patterns an indispensable tool for traders pursuing diversified strategies in multiple trading environments.
- Quick Insights: Candlestick patterns provide immediate insights into market activity and sentiment within a single session. This real-time analysis is invaluable for day traders and scalpers who depend on fast decision-making. Recognizing such patterns helps them act promptly on emerging opportunities and capitalize on short-term trends.
- Risk Management: Patterns like doji or spinning top highlight market indecision, helping traders reassess their strategies effectively. By identifying these signals, traders can pause, adjust their positions, or exit trades to reduce exposure to risks. This enables more calculated decisions in volatile or uncertain market conditions.
Disadvantages
- False Signals: Bullish and bearish candlestick patterns can produce misleading signals during volatile markets. Traders relying solely on these patterns may make incorrect decisions, leading to financial losses. Additional analysis is necessary to confirm signals and reduce the impact of false indications during unpredictable market conditions.
- Limited Context: Candlestick patterns provide no information about fundamental factors like economic news, interest rates, or geopolitical events. These external factors significantly influence price movements. Relying only on candlestick patterns may leave traders unaware of critical developments, leading to incomplete analysis and flawed trading strategies.
- Subjectivity: The interpretation of candlestick patterns can differ among traders. What appears as a reversal signal to one trader may seem like a continuation signal to another. This subjectivity often leads to inconsistent strategies and makes relying solely on candlestick analysis less reliable in certain situations.
- Dependence on Timeframes: Candlestick patterns differ across various timeframes, causing potential conflicts in analysis. A pattern visible in a short timeframe, like a 15-minute chart, may contradict trends in longer timeframes, such as daily or weekly charts. This can make drawing accurate conclusions challenging for traders.
- Over-reliance Risk: Relying exclusively on candlestick patterns without considering other tools or indicators increases trading risks. Market complexities require a broader analysis to make sound decisions. Ignoring complementary data or technical methods may result in poor outcomes, particularly in unpredictable market environments.
Difference Between Bullish And Bearish – Quick Summary
- The main difference between bullish and bearish lies in their direction, with bullish signaling optimism and rising prices, while bearish reflects pessimism and falling prices.
- The primary role of a bullish candlestick is to indicate upward price movement, representing market optimism and strong buying pressure.
- The main purpose of a bearish candlestick is to signify downward price movement, highlighting market pessimism and dominance of selling activity.
- The key distinction between bullish and bearish candlestick patterns lies in their signal, with bullish patterns predicting price increases and bearish patterns indicating potential declines in price.
- The primary advantage of bullish and bearish candlestick patterns is their ability to visually show market trends, while their disadvantage is their susceptibility to false signals in volatile conditions.
- To make smarter trading decisions and analyze bullish and bearish patterns effectively, explore Alice Blue Online’s advanced trading platform. Start trading confidently with Alice Blue today!

Bullish Vs Bearish – FAQ
Bullish candlestick patterns represent upward price movements and buyer dominance, while bearish patterns reflect downward price movements and seller control. These patterns provide traders with insights into market sentiment and potential price trends.
A bullish candlestick indicates a price increase during a session due to buying activity, while a bearish candlestick signifies a price decline driven by selling pressure. Both patterns help traders assess market conditions effectively.
The strongest candlestick pattern is the engulfing pattern. A bullish engulfing shows strong buyer momentum, while a bearish engulfing indicates intense selling pressure, signaling potential market reversals and helping traders predict future price movements accurately.
Bullish is favorable during rising markets, offering buying opportunities, while bearish benefits traders in declining markets through short-selling or hedging. The preference depends entirely on individual trading strategies and current market trends.
A market is bullish when prices consistently rise, supported by positive sentiment, while bearish markets are marked by falling prices and increased selling pressure, reflecting investor pessimism and concerns about future performance.
A stop loss is a predefined order to limit trading losses by automatically closing a position when the asset reaches a specific price. It protects traders during unexpected market movements or volatility.
A bearish candlestick signals a sell opportunity as it represents declining prices and strong selling pressure. Traders often use this signal to exit existing positions or initiate short-selling strategies during downtrends.


