


The main difference between the Doji candlestick pattern and the Spinning Top candlestick pattern lies in their structure and market signals. A Doji has almost equal open and close prices, showing indecision. A Spinning Top has small real bodies with longer wicks, indicating weak momentum.
Contents:
- What Is A Doji Candlestick Pattern?
- What Is a Spinning Top Candlestick Pattern?
- Differences Between Doji Candlestick And Spinning Top Candlestick Pattern
- How Does Doji Candlestick Pattern Work?
- How Does Spinning Top Candlestick Pattern Work?
- Formation Process Of Spinning Top Candlestick Pattern
- Characteristics Of Spinning Top Candlestick Pattern
- Characteristics Of Doji Candlestick Pattern
- Doji Candlestick Pattern And Spinning Top Candlestick Pattern – Quick Summary
- Doji Candlestick Pattern Vs Spinning Top Candlestick Pattern – FAQs
What Is A Doji Candlestick Pattern?
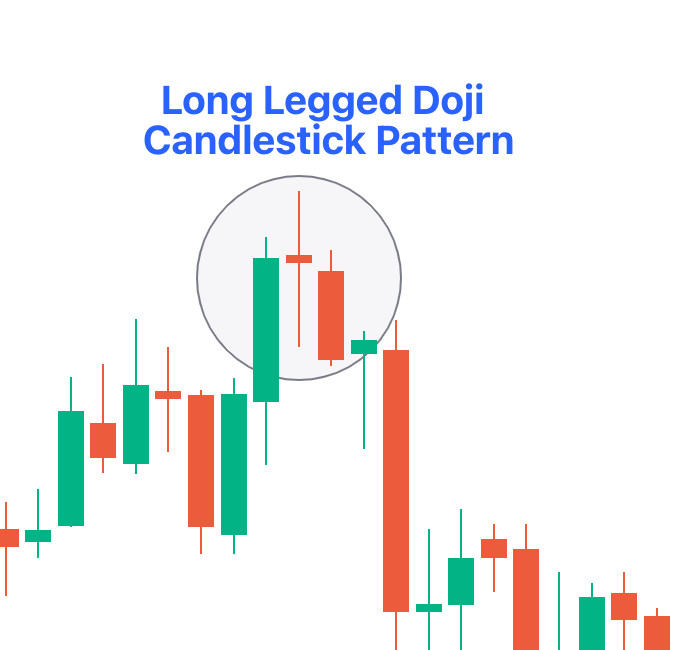
A Doji candlestick pattern forms when the opening and closing prices are nearly the same. This creates a small or non-existent body with long wicks. It signals market indecision, where buyers and sellers are equally strong, often indicating a potential reversal or consolidation.
A Doji appears when buying and selling forces are balanced. It reflects hesitation in the market, making it an important signal for traders. Doji patterns can form at key levels of support or resistance, influencing market direction. There are different types of Doji, such as the Dragonfly Doji, Gravestone Doji, and Long-Legged Doji, each with unique implications.
A Doji alone is not a confirmation of a trend reversal. Traders often wait for additional signals like volume shifts or the next candlestick pattern before making trading decisions. Understanding its position within the broader trend is crucial for accurate analysis.

What Is a Spinning Top Candlestick Pattern?
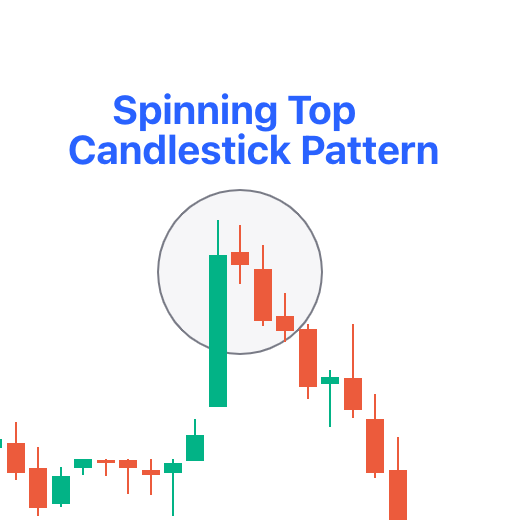
A Spinning Top candlestick pattern forms when the opening and closing prices are close, but the candle has long upper and lower wicks. This indicates market uncertainty, where buyers and sellers push prices in both directions before closing near the opening level.
A Spinning Top appears when neither buyers nor sellers dominate the market. It suggests reduced momentum and possible trend reversal or continuation, depending on the broader trend. This pattern is common in both uptrends and downtrends, signaling indecision among traders. Unlike a Doji, a Spinning Top has a small real body, meaning some price movement occurs before closing.
Traders analyze Spinning Tops alongside volume and other indicators for confirmation. If it forms at key support or resistance levels, it holds greater significance. It is best used with additional technical signals to confirm a potential price movement.
Differences Between Doji Candlestick And Spinning Top Candlestick Pattern
The main difference between the Doji candlestick and the Spinning Top candlestick pattern lies in their structure and market interpretation. A Doji has almost equal open and close prices, signaling strong indecision. A Spinning Top has a small real body with long wicks, showing weak momentum and potential consolidation.
| Parameter | Doji Candlestick Pattern | Spinning Top Candlestick Pattern |
| Structure | Open and close prices are nearly the same, forming a small or non-existent body. | Small real body with long upper and lower wicks, showing some price movement. |
| Market Signal | Indicates strong indecision, where buyers and sellers cancel each other out. | Suggests market hesitation but with slight price movement before closing. |
| Strength of Indecision | High, as it shows equal pressure from both sides. | Moderate, as some control exists before the close. |
| Common Interpretation | Seen as a sign of trend reversal or market indecision. | Suggests a pause in the trend, which can lead to either continuation or reversal. |
| Relevance in Trends | More significant when appearing at the end of trends. | Can appear in both trending and sideways markets, signaling reduced momentum. |
| Types | Includes Dragonfly Doji, Gravestone Doji, and Long-Legged Doji. | No major variations, only classified based on position within trends. |
| Reliability | Requires confirmation from the next candlestick or volume shift. | Needs additional confirmation but generally suggests weaker momentum compared to Doji. |
How Does Doji Candlestick Pattern Work?
The Doji Candlestick Pattern functions by showing market indecision when the opening and closing prices are nearly the same. It appears when buying and selling forces balance each other, preventing significant price movement. This pattern often signals potential trend reversals or consolidation phases in market.
- Reflects Market Indecision: A Doji forms when buyers and sellers push the price in both directions but fail to establish dominance. The candle’s wicks indicate price fluctuations, but the small or nonexistent body shows that neither side gained control. This uncertainty makes it an important signal for traders.
- Signals Possible Trend Reversal: A Doji appearing after a strong trend can indicate that momentum is fading. If it forms after an uptrend, it may signal a bearish reversal. If it appears after a downtrend, it may suggest a bullish reversal. Traders wait for confirmation before acting on this signal.
- Forms at Key Market Levels: The Doji pattern is more significant when it forms near support or resistance levels. At resistance, it suggests buyers are losing strength. At support, it indicates sellers are struggling to push prices lower. These locations make Doji a stronger signal for potential reversals.
- Works Best with Additional Confirmation: A Doji alone does not confirm a trend change. Traders look for the next candlestick to confirm the direction. A bearish follow-up candle after a Doji strengthens a potential downtrend, while a bullish candle suggests upward momentum. Volume analysis also helps validate the signal.
- Different Types Indicate Specific Market Sentiment: Variations like the Dragonfly Doji, Gravestone Doji, and Long-Legged Doji provide different insights. A Dragonfly Doji signals bullish rejection of lower prices, while a Gravestone Doji suggests bearish rejection of higher prices. Identifying the right type helps traders interpret market sentiment accurately.
How Does Spinning Top Candlestick Pattern Work?
The Spinning Top Candlestick Pattern functions by signaling market indecision when the opening and closing prices are closed with long wicks. Buyers and sellers push prices in both directions, but neither side dominates, creating uncertainty in trend direction and suggesting a possible slowdown in momentum.
- Shows Reduced Momentum in the Market: A Spinning Top appears when a trend starts losing strength. Buyers push the price higher, and sellers push it lower, but neither side dominates. The small real body shows limited price movement, suggesting that the ongoing trend is slowing and a possible shift may occur.
- Forms in Both Uptrends and Downtrends: This pattern can appear in any trend and does not always indicate a reversal. In an uptrend, it suggests that buying pressure is weakening. In a downtrend, it signals that sellers are losing control. Traders observe the next candlestick to determine the market’s direction.
- Indicates Market Hesitation: The presence of long upper and lower wicks shows price rejection from both sides. Buyers attempt to push prices higher, but selling pressure forces it back down. Similarly, sellers try to lower prices, but buyers push them back up. This indecision leads to market hesitation.
- More Significant at Key Price Levels: A Spinning Top at resistance indicates buyers are losing strength, making it harder to push prices higher. At support, it suggests sellers are struggling to lower prices. These key levels add significance to the pattern, helping traders assess potential reversals or trend continuations.
- Needs Confirmation for Stronger Signals: A Spinning Top alone does not confirm a reversal. Traders watch the next candle to see if buyers or sellers gain control. A strong bullish candle after a Spinning Top supports a price increase, while a strong bearish candle signals further decline. The volume also helps validate the trend.
Formation Process Of Spinning Top Candlestick Pattern
The Spinning Top Candlestick Pattern forms by indicating market uncertainty with a small real body and long wicks. Buyers and sellers push the price in both directions, but neither side dominates, resulting in a closing price near the opening level, reflecting indecision.
- Initial Price Movement Sets the Stage: The pattern begins when the market opens at a specific price level. Buyers and sellers both react, causing price movement in both directions. The market does not immediately establish a clear trend, leading to fluctuations in price before forming the final candlestick structure.
- Buyers Push the Price Higher: After the market opens, buyers attempt to drive the price upward. Strong buying pressure briefly dominates, creating a high wick. However, the momentum is not strong enough to sustain a breakout, and sellers step in, pushing the price back down toward the opening level.
- Sellers Drag the Price Lower: As the price reaches a temporary high, sellers gain control and push it downward. This downward movement forms the lower wick. However, selling pressure also weakens, preventing a strong continuation. Buyers re-enter the market, bringing the price back near the opening level.
- Closing Price Remains Near the Opening Price: After both buyers and sellers have influenced price movements, the market settles near the initial opening price. This results in a small real body between the upper and lower wicks. The final structure confirms indecision, as neither buyers nor sellers establish a clear trend.
- Candlestick Shape Reflects Market Hesitation: The long wicks indicate strong price movements in both directions, but the small body shows that neither side controlled the market. This balance between buyers and sellers makes the Spinning Top a neutral pattern, requiring further confirmation for a potential trend direction.
Characteristics Of Spinning Top Candlestick Pattern
The main characteristic of Spinning Top Candlestick Pattern is its small real body with long upper and lower wicks. It shows market indecision, where buyers and sellers push prices in both directions but fail to establish dominance, leading to a close near the opening price.
- Small Real Body Reflects Minimal Price Change: A Spinning Top has a small real body, showing that the opening and closing prices are close. This indicates that despite price movement, neither buyers nor sellers gained full control. The small body differentiates it from stronger candlestick patterns that signal clear trend direction.
- Long Wicks Indicate Price Rejection: The upper and lower wicks of a Spinning Top show that the price moved significantly in both directions during the session. However, these movements were rejected as the market returned near the opening price. This rejection highlights uncertainty among traders regarding the next price move.
- Appears in Both Uptrends and Downtrends: A Spinning Top can form in any trend, making it a flexible pattern. In an uptrend, it suggests weakening buying pressure, while in a downtrend, it signals decreasing selling strength. The context of the trend helps determine whether the market may continue or reverse.
- Represents Market Indecision: This pattern indicates that buyers and sellers are equally strong, leading to hesitation in the market. The balance between buying and selling pressure prevents a clear direction. Traders analyze additional indicators to understand if the market will continue the trend or reverse.
- More Significant at Key Price Levels: When a Spinning Top appears near support or resistance, it carries more weight. At resistance, it suggests buyers are struggling to push higher. At support, it signals sellers are failing to push lower. These levels help traders assess the pattern’s relevance.
- Requires Confirmation for Stronger Signals: A Spinning Top alone does not indicate a trend reversal. Traders look at the next candlestick to see if buyers or sellers take control. If a strong bullish candle follows, it confirms buying strength. If a bearish candle appears, it signals further downside.
Characteristics Of Doji Candlestick Pattern
The main characteristic of Doji Candlestick Pattern is its nearly equal opening and closing prices, creating a small or nonexistent real body. It signals market indecision, where buying and selling pressures are balanced, preventing a clear trend direction and suggesting a potential reversal or consolidation.
- Minimal or No Real Body Indicates Indecision: A Doji forms when the opening and closing prices are nearly identical, creating a very small or nonexistent real body. This lack of movement reflects a balance between buyers and sellers, making it different from other candlestick patterns that show clear directional control.
- Long Wicks Represent Market Struggle: The upper and lower wicks in a Doji show price fluctuations during the session. Buyers push the price higher, and sellers drag it lower, but neither side maintains control. The long wicks indicate strong participation from both sides but no clear dominance.
- Appears in Both Uptrends and Downtrends: A Doji can form at any point in a trend, making it useful for identifying market hesitation. In an uptrend, it may signal that buyers are losing momentum. In a downtrend, it suggests that sellers are struggling to push prices lower, hinting at a possible reversal.
- Signals Potential Trend Reversal or Continuation: The Doji itself does not confirm a trend reversal but suggests that traders should watch for further signals. If it appears at a key support or resistance level, it becomes more significant. The market’s reaction in the next session helps determine if the trend will continue or change.
- Different Types Indicate Varying Market Sentiment: The Doji has multiple variations, each with unique market implications. A Dragonfly Doji suggests bullish rejection of lower prices, while a Gravestone Doji indicates bearish rejection of higher prices. A Long-Legged Doji reflects extreme indecision, making it essential to analyze its context.
- More Reliable When Combined with Other Indicators: A Doji alone does not provide enough information for a trade decision. Traders use technical indicators like RSI, moving averages, or volume analysis to confirm its significance. A Doji followed by a strong bullish or bearish candle offers a clearer trend signal.
Doji Candlestick Pattern And Spinning Top Candlestick Pattern – Quick Summary
- The main difference between the Doji and Spinning Top candlestick patterns lies in their formation and market signals. A Doji has nearly equal open and close prices, showing strong indecision, while a Spinning Top has a small real body with long wicks, indicating weak momentum.
- A Doji candlestick pattern forms when the opening and closing prices are nearly identical. It signals market hesitation, where buying and selling forces cancel each other out, often appearing before trend reversals or consolidation phases.
- A Spinning Top candlestick pattern has a small real body and long upper and lower wicks. It indicates uncertainty, showing that buyers and sellers are active but unable to establish control, leading to a potential continuation or reversal.
- The primary difference between a Doji and a Spinning Top is their level of indecision. A Doji reflects complete hesitation, while a Spinning Top shows slight momentum from buyers or sellers before closing near the opening price.
- A Doji candlestick pattern works by forming in a trend where buying and selling pressures are balanced. It signals potential trend reversals or slowdowns, but traders rely on the next candlestick for confirmation before making market decisions.
- A Spinning Top candlestick pattern works by highlighting market hesitation with a small real body and long wicks. It shows reduced momentum, requiring further confirmation from the next price movement to determine if the trend will continue or reverse.
- The key to the Spinning Top’s formation is its small real body and extended wicks. It forms when buyers push the price up, sellers drag it down, and neither side gains control, resulting in a closing price near the opening level.
- The main characteristic of a Spinning Top is its long upper and lower wicks with a small real body. It appears in both uptrends and downtrends, signaling hesitation and requiring additional confirmation before traders act.
- The primary characteristic of a Doji is its nearly equal open and close prices, forming a small or nonexistent real body. It represents market indecision and often suggests a trend reversal when combined with other indicators.
- Want to make better trading decisions with accurate candlestick analysis? Alice Blue Online provides advanced tools, real-time market insights, and expert guidance to help traders refine their strategies. Start trading with confidence today!

Doji Candlestick Pattern Vs Spinning Top Candlestick Pattern – FAQs
The main difference is in their structure and market signal. A Doji has nearly equal open and close prices, showing strong indecision, while a Spinning Top has a small real body with long wicks, indicating weak momentum.
After a Doji, the market direction depends on the next candlestick. A strong bullish candle signals upward movement, while a bearish candle confirms a downtrend. Traders wait for confirmation before making trading decisions.
A Spinning Top candle indicates market hesitation. It shows buyers and sellers pushed prices in both directions but failed to establish control. It can signal a possible reversal or trend continuation, depending on confirmation.
A Doji is neither strictly bullish nor bearish. It reflects indecision and market balance. Its impact depends on the context. A Doji after an uptrend may signal bearish reversal, while in a downtrend, it suggests possible bullish movement.
A Doji can signal a potential reversal, but it is not always a reversal pattern. It shows indecision and requires confirmation from the next candlestick to determine if the trend will continue or change direction.
After a Spinning Top, the market can continue in the same direction or reverse. Traders analyze the next candlestick and technical indicators to confirm whether buyers or sellers gain control over price movement.
The main types of Doji are Dragonfly Doji, Gravestone Doji, and Long-Legged Doji. Each has different market implications based on wick size and position within a trend, signaling indecision or reversal potential.
A Spinning Top forms due to equal pressure from buyers and sellers. Both sides attempt to control the market, but neither succeeds, leading to a small real body with long wicks and market hesitation.


