


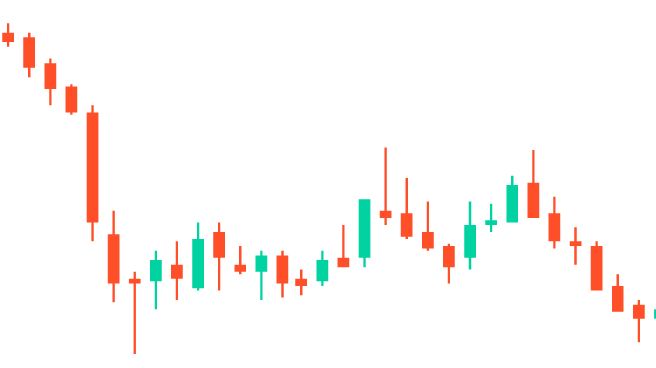
A candlestick chart visually represents the price movements of a financial asset over a specific period. It shows opening, closing, high, and low prices, helping traders analyze trends and patterns. Each candlestick represents market sentiment, showing price movements to help traders.
Contents:
What is a Candlestick Chart?
A candlestick chart is a graphical tool that shows the price movement of an asset over a specific time frame. It displays the opening, closing, high, and low prices, providing a clear picture of market trends. Traders use it to analyze price behaviour.
Candlestick charts visually combine data to represent price movements over a specific period. Each candlestick consists of a body and wicks, providing detailed insights. The body shows the price range between opening and closing, while the upper and lower wicks indicate the highest and lowest prices. Different colours often distinguish bullish (price increase) and bearish (price decrease) movements, making trends easy to spot. Widely used in financial markets, these charts help traders identify patterns, predict trends, and make data-driven decisions based on historical price behaviour.

Composition of a Candlestick Chart
The primary compositions of a candlestick chart are the body and wicks, which together summarize price movements during a specific time frame. The body highlights the opening and closing prices, while the upper and lower wicks indicate the highest and lowest prices achieved in that period.
- The Body: The body is the main part of a candlestick that shows the price range between the opening and closing values. A filled or coloured body indicates a price drop during the time frame, while an unfilled or lighter-coloured body represents a price increase, signalling bullish behaviour.
- Upper Wick: The upper wick, also known as the shadow, stretches above the body and represents the highest price reached during the period. A long upper wick indicates significant selling pressure as the price drops from its peak. It provides insights into market resistance and potential reversal zones.
- Lower Wick: The lower wick extends below the body and represents the lowest price recorded during the time frame. A longer lower wick shows strong buying pressure, as prices recovered after hitting the low. This feature helps traders identify support levels and potential upward movement in the market.
- Colours of the Candlestick: Colors make candlesticks easy to interpret. Green or white indicates a bullish trend where prices closed higher than they opened, showing a price rise. Red or black signals a bearish trend where prices closed lower than they opened. These colours offer a quick snapshot of market sentiment.
How to Read Candlestick Charts for Stocks?
The best way to read a candlestick chart for stocks is by interpreting its components to understand price behaviour. The body reflects whether the stock closed higher or lower than it opened, while the wicks show price extremes. Chart patterns reveal trends and possible reversals.
- Identify Bullish and Bearish Candles: Bullish candles, often green or white, show that the stock closed higher than it opened, signalling buying strength. Bearish candles, typically red or black, indicate the stock closed lower than it opened, showing selling pressure. This differentiation helps analyze market sentiment quickly.
- Observe Candle Size: The size of the candlestick body provides insight into price volatility. A long body signals strong buying or selling momentum, while a short body reflects indecision or minimal price movement. Analyzing candle sizes can reveal shifts in market dynamics and trader behaviour.
- Analyze Wick Lengths: Wick lengths provide clues about price rejection levels. A long upper wick shows resistance at higher prices, suggesting selling pressure. On the other hand, a long lower wick indicates support at lower prices, reflecting buying interest. These signals help in determining potential entry or exit points.
- Recognize Candlestick Patterns: Common patterns, such as Doji, Hammer, and Engulfing, give valuable insights into market direction. A Doji signals indecision, while a Hammer suggests potential reversal. Recognizing these patterns in a stock chart can help in predicting future price movements and trend changes effectively.
How to Analyse Candlestick Chart?
The most effective way to analyse a candlestick chart is by studying its patterns, body, and wicks to understand market sentiment. Each candlestick reveals price behaviour, and recognizing trends or patterns helps traders make decisions based on potential future movements.
- Examine Trend Direction: Start by observing the overall trend of the chart. A series of bullish candles indicates an upward trend, while bearish candles suggest a downward trend. Identifying trends early helps traders match their strategies with market momentum and avoid counter-trend risks.
- Identify Key Patterns: Look for patterns such as Hammer, Shooting Star, or Engulfing. These patterns provide clear signals about market behaviour. For instance, a Hammer often indicates a potential reversal after a downtrend, while an Engulfing pattern highlights a strong shift in buying or selling pressure.
- Assess Candlestick Size: The size of the candlestick reflects the strength of market activity. A large body indicates high buying or selling momentum, while a small body signals market indecision. Monitoring candlestick sizes helps traders understand volatility and predict possible price changes effectively.
- Analyze Wick Lengths: Study the length of the wicks for insights into price rejection. A long upper wick may show resistance at higher prices, while a long lower wick reflects strong support. These clues help traders identify potential entry or exit points with more precision.
How to Read Candlestick Charts for Intraday Trading?
The best way to read candlestick charts for intraday trading is by focusing on short time frames and identifying price trends. Each candlestick reveals real-time market movements, helping traders spot patterns, manage risks, and make quick, informed trading decisions during the day.
- Monitor Key Time Frames: Focus on shorter time frames like 1-minute, 5-minute, or 15-minute charts. These intervals provide detailed insights into quick price movements, allowing traders to identify opportunities and make fast decisions. Intraday traders rely on quick analysis to maximize gains within limited trading hours.
- Identify Reversal Patterns: Look for patterns like Morning Star, Shooting Star, or Doji. These patterns signal potential reversals, helping traders anticipate sudden changes in price direction. Recognizing these patterns early in intraday trading is crucial for staying ahead of quick market shifts.
- Observe Volume with Candlesticks: Combine candlestick analysis with trading volume. A strong, bullish or bearish candle with high volume confirms a reliable trend. On the other hand, low volume during significant price movements may signal weak trends. This integration improves decision-making and minimizes the risks of false signals.
- Pay Attention to Breakouts: Monitor candlestick formations at support and resistance levels for potential breakouts. A breakout with a strong candlestick often signals a sustained price movement in the breakout direction. Identifying these moments helps intraday traders capture profitable entry and exit points effectively.
How to Read a Candlestick Chart – Quick Summary
- To read a candlestick chart, focus on understanding the body and wicks to analyze price movements and identify trends.
- A candlestick chart visually represents price data, including opening, closing, high, and low prices, for easy market analysis.
- The key components of a candlestick chart are the body and wicks, which reveal price ranges, extremes, and market sentiment within a time frame.
- To read candlestick charts for stocks, study the patterns, body, and wicks to interpret market trends and make informed decisions.
- The primary way to analyze candlestick charts is by observing patterns, candle size, and wick lengths to predict price movements effectively.
- To read candlestick charts for intraday trading, focus on short time frames, monitor volume, and identify patterns for timely trading decisions.
- Learn how to master candlestick charts and make confident trading decisions with Alice Blue Online. Start your trading journey with the right tools and guidance today!

How to Read a Candlestick Chart – FAQ
A candlestick chart is a financial tool that visually represents an asset’s price movements over time, displaying the opening, closing, high, and low prices for easy analysis of market trends and sentiment.
To read a candlestick chart, understand its body and wicks. The body shows price changes between opening and closing, while the wicks reveal the highest and lowest prices during the selected time frame.
The 5 candle rule involves analyzing five consecutive candlesticks to confirm a trend. If the trend sustains over five candles, it indicates the market’s strength and potential direction for informed trading decisions.
The rarest candlestick pattern is the “Tri-Star Doji.” It consists of three consecutive Doji candles, signaling significant market indecision and often predicting a potential reversal in the current market trend.
Munehisa Homma, an 18th-century Japanese rice trader, is regarded as the father of candlestick patterns due to his innovative techniques in analyzing market psychology and price movements for effective trading strategies.
To calculate a candlestick, record the asset’s opening, closing, high, and low prices for a specific period. These values define the candlestick’s body and wicks, representing market activity and price range.


