


The main difference between a Shooting Star and a Hanging Man is their position in a trend. A Shooting Star appears after an uptrend and signals a potential reversal. A Hanging Man forms after an uptrend but suggests weakness rather than a strong reversal.
Contents:
- What is a Shooting Star Pattern?
- What is a Hanging Man Pattern?
- Differences Between Shooting Star and Hanging Man
- How Does Shooting Star Candlestick Pattern Work?
- How Does Hanging Man Candlestick Pattern Work?
- Characteristics of Shooting Star Pattern
- Importance of Shooting Star Pattern
- Characteristics of Hanging Man Pattern
- Importance of Hanging Man Pattern
- Shooting Star and Hanging Man Patterns – Quick Summary
- Shooting Star vs Hanging Man – FAQs
What is a Shooting Star Pattern?
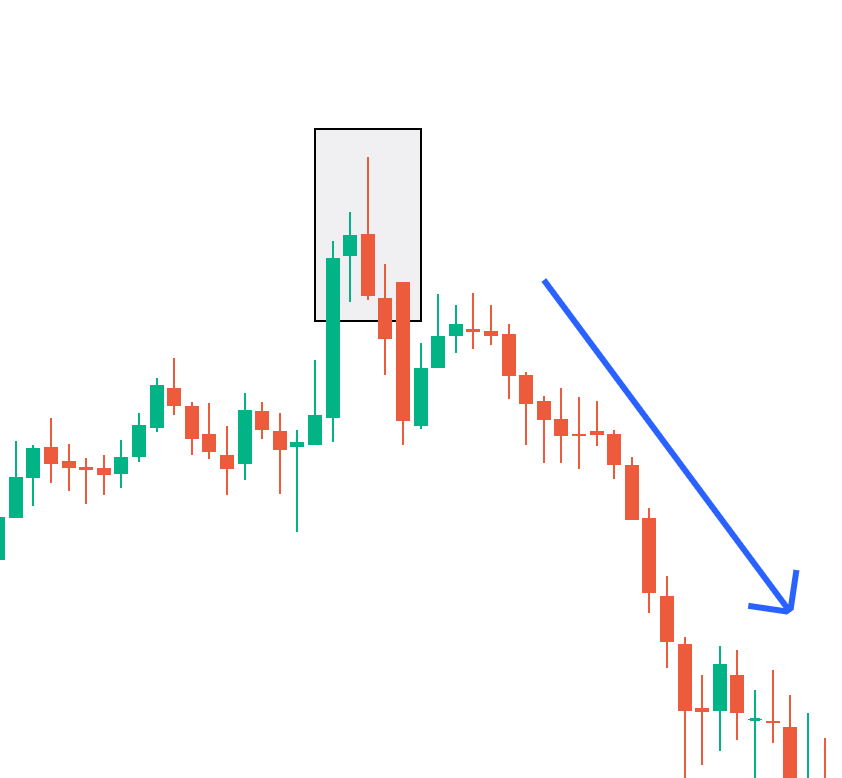
A Shooting Star pattern is a bearish candlestick that appears after an uptrend. It has a small body, a long upper wick, and little to no lower wick. This formation signals that buyers pushed prices up but lost control, allowing sellers to drive prices down.
This pattern shows a failed attempt to sustain higher prices. The long upper wick reflects strong buying pressure that faded quickly as sellers took control. Traders see it as a sign of a potential reversal, especially if the next candle confirms weakness with a bearish close. Volume plays a crucial role in confirming its strength. A Shooting Star near key resistance increases its reliability, as it indicates sellers are overpowering buyers. Traders often wait for further confirmation before making trading decisions.

What is a Hanging Man Pattern?
A Hanging Man pattern is a bearish candlestick that appears after an uptrend. It has a small body, a long lower wick, and little to no upper wick. This formation suggests that sellers pushed prices down during the session, but buyers attempted to regain control before the close.
This pattern signals weakness in an ongoing uptrend. The long lower wick shows selling pressure, even though buyers managed to recover some ground. If the next candle confirms selling strength, traders see it as a potential reversal signal. A Hanging Man near resistance suggests that buyers are losing control, making it harder for the uptrend to continue. Higher trading volume adds to its reliability, as increased activity indicates stronger selling pressure. Traders often wait for a bearish close before confirming the trend shift.
Differences Between Shooting Star and Hanging Man
The primary difference between a Shooting Star and a Hanging Man is their position in a trend. A Shooting Star appears after an uptrend and signals a potential reversal. A Hanging Man also forms after an uptrend but suggests weakness rather than a strong reversal.
| Parameter | Shooting Star | Hanging Man |
| Trend Position | Forms after an uptrend | Forms after an uptrend |
| Indication | Signals a potential trend reversal | Suggests that the uptrend is losing strength |
| Candle Body | Small real body near the low of the candle | Small real body near the high of the candle |
| Wick Formation | Long upper wick, little to no lower wick | Long lower wick, little to no upper wick |
| Market Sentiment | Shows that buyers pushed prices higher but failed to hold gains | Shows that sellers tried to push prices lower but buyers managed a partial recovery |
| Confirmation Needed | A bearish candle after the Shooting Star confirms the reversal | A bearish candle after the Hanging Man confirms weakness |
| Reliability Factors | More reliable when near strong resistance and supported by high volume | More reliable when near resistance and accompanied by increased selling pressure |
| Trading Strategy | Traders often enter short positions after confirmation with a stop-loss above the high | Traders wait for confirmation before deciding, often using a stop-loss above the Hanging Man |
How Does Shooting Star Candlestick Pattern Work?
The Shooting Star candlestick pattern functions by signaling a potential reversal after an uptrend. It forms when buyers push prices higher, but strong selling pressure forces a close near the opening level. The long upper wick indicates rejection of higher prices, making traders cautious about continued upward movement.
- Formation Process: A Shooting Star forms when buyers dominate early in the session and push the price higher. However, sellers step in and erase most of the gains before the session ends. The closing price remains near or below the opening price, creating a small body and a long upper wick.
- Market Psychology: This pattern reflects a shift in sentiment. Buyers attempt to drive prices up, but strong selling pressure prevents sustained gains. The long upper wick shows that bulls are losing strength. If the next candle confirms a downward move, it signals that bears are taking control.
- Confirmation Requirement: A Shooting Star alone is not a confirmation of a reversal. Traders wait for a bearish candle to follow, confirming selling pressure. A lower close after the pattern strengthens its validity. Without confirmation, the price may continue upward, making premature trades risky.
- Volume’s Role: Higher volume increases the pattern’s reliability. If a Shooting Star forms with a strong volume, it indicates significant selling pressure. A weak volume Shooting Star may not carry enough weight for traders to trust a reversal. Volume helps determine if the signal is strong or weak.
- Best Trading Strategies: Traders usually enter short positions after a confirmed bearish close. Stop-loss orders are placed above the Shooting Star’s high to limit risk. Risk management is crucial because false signals can occur. Combining this pattern with resistance levels and indicators improves trading accuracy.
- Key Considerations for Accuracy: A Shooting Star near resistance makes the signal stronger. If the pattern appears in the middle of a trend without strong resistance, its impact weakens. Traders also look at RSI, MACD, or moving averages to confirm selling strength before making decisions.
How Does Hanging Man Candlestick Pattern Work?
The Hanging Man candlestick pattern functions by signaling potential weakness in an uptrend. It forms when selling pressure increases during the session, but buyers push prices back near the opening level. The long lower wick shows that sellers attempted to reverse the trend, making traders cautious about further upward movement.
- Formation Process: A Hanging Man forms when sellers drive prices lower after the market opens, but buyers regain control and push prices back near the opening level. This results in a small body with a long lower wick. The inability to sustain lower prices indicates temporary buyer strength but raises concerns.
- Market Psychology: This pattern reflects rising selling pressure in an uptrend. The long lower wick shows that bears attempted to take control, but bulls managed to recover. However, the presence of strong selling within the session suggests that buyers are losing momentum. A bearish confirmation candle strengthens the pattern’s reliability.
- Confirmation Requirement: The Hanging Man does not confirm a trend reversal on its own. Traders look for a bearish candle after it forms, which signals that selling pressure is increasing. If the next candle closes lower, it confirms weakness. Without confirmation, the uptrend may continue, making early trades risky.
- Volume’s Role: High volume during a Hanging Man pattern strengthens its signal. If volume is low, the selling pressure may not be strong enough to influence the trend. Traders use volume as a key factor to determine whether the pattern indicates a real shift in sentiment or a temporary pullback.
- Best Trading Strategies: Traders wait for confirmation before entering a short position. If the next candle closes lower, they may sell with a stop-loss above the Hanging Man’s high. Combining the pattern with resistance levels and technical indicators, such as RSI or MACD, improves accuracy and reduces false signals.
- Key Considerations for Accuracy: A Hanging Man near strong resistance is more reliable than one appearing in the middle of a trend. Traders use additional indicators to confirm selling pressure before making decisions. If the overall market sentiment is bullish, a Hanging Man alone may not be enough to trigger a reversal.
Characteristics of Shooting Star Pattern
The main characteristic of Shooting Star pattern is its small body and long upper wick. It forms after an uptrend and signals a potential reversal. The long wick shows that buyers pushed prices higher, but strong selling pressure forced a close near the opening level.
- Candle Structure: A Shooting Star has a small real body near the low of the candle and a long upper wick. The lower wick is either very small or absent. This structure shows that buyers lost control after an initial price surge, leading to a weak closing position.
- Trend Position: This pattern appears after an extended uptrend. It signals that buying momentum may be fading. Traders look for a Shooting Star near resistance levels, as its presence in such areas increases the likelihood of a trend reversal, making it more reliable for decision-making.
- Wick-to-Body Ratio: The upper wick is at least twice the size of the real body. A longer wick indicates stronger rejection of higher prices. The small body near the low reinforces the idea that selling pressure overpowered buying attempts, creating a warning sign for traders.
- Market Sentiment Shift: A Shooting Star represents a shift in control from buyers to sellers. It shows that bulls initially dominated but failed to maintain gains. The strong pushback from bears suggests that selling interest is increasing, raising concerns about the sustainability of the existing uptrend.
- Confirmation Requirement: The pattern alone does not confirm a reversal. Traders wait for the next candle to close lower for confirmation. A strong bearish follow-up candle increases the pattern’s reliability, while a bullish close weakens its impact, signaling that the uptrend may still be intact.
- Volume Impact: Higher volume strengthens the Shooting Star’s significance. Increased trading activity during the formation suggests strong selling pressure. If volume is low, the pattern may not hold much weight. Traders consider volume as a key factor in deciding whether to act on the signal.
- Use in Trading Strategies: Traders use the Shooting Star as an early warning sign. It is most effective when combined with resistance levels, technical indicators, and price action analysis. A strong confirmation candle, along with additional signals, helps traders make more informed decisions before entering a trade.
Importance of Shooting Star Pattern
The primary importance of the Shooting Star pattern is its ability to signal a potential reversal after an uptrend. It warns traders that buying pressure is weakening and selling pressure is increasing. This helps traders assess risk, identify exit points, and make informed decisions.
- Early Reversal Signal: A Shooting Star gives an early warning of a possible trend change. It forms when buyers push prices higher, but strong selling pressure forces a weak close. This shift in momentum suggests that bulls are losing control, making traders cautious about further upside movement in the market.
- Helps in Risk Management: This pattern helps traders manage risk by providing a potential exit signal. If a Shooting Star appears near resistance, traders may reduce long positions or set tighter stop-loss levels. This approach helps protect gains and prevents unnecessary losses if the trend reverses.
- Used for Short-Selling Opportunities: Traders looking for short-selling opportunities use the Shooting Star as a bearish signal. A confirmed reversal allows them to enter short positions with a stop-loss above the candle’s high. This pattern is especially useful in volatile markets where quick trend changes can impact trading decisions.
- Works Well with Resistance Levels: The pattern is more reliable when it appears near strong resistance. Resistance levels already indicate potential selling pressure. When combined with a Shooting Star, the probability of a reversal increases. Traders use this combination to strengthen their technical analysis before taking action.
- Better Decision-Making with Confirmation: A Shooting Star alone does not confirm a reversal. Traders wait for a bearish candle to follow, confirming selling strength. This confirmation step prevents false signals and helps traders make more confident decisions about whether to exit long positions or enter short trades.
- Supports Technical Analysis Strategies: The pattern becomes more effective when combined with other indicators like RSI, MACD, and moving averages. These indicators help validate the bearish signal, ensuring traders do not act on a weak or unreliable pattern. A Shooting Star with additional confirmation strengthens trading strategies.
- Useful in Multiple Timeframes: Traders use the Shooting Star across different timeframes, from intraday to long-term charts. It helps scalpers, swing traders, and different investors identify market trends. Its ability to provide signals in various timeframes makes it a valuable tool in technical analysis.
Characteristics of Hanging Man Pattern
The fundamental characteristic of the Hanging Man pattern is its small real body and long lower wick. It forms after an uptrend and signals potential weakness. The long wick shows that sellers pushed prices lower during the session, but buyers recovered, raising concerns about the trend continuing further.
- Candle Structure: A Hanging Man has a small body near the high of the candle and a long lower wick. The upper wick is either very small or absent. This formation indicates that sellers attempted to drive prices down but failed to sustain the downward move by the session close.
- Trend Position: This pattern forms after an extended uptrend. It does not confirm a reversal on its own, but it signals that buying pressure may be weakening. If sellers gain more control in the next session, the probability of a trend shift increases, making it a key warning sign.
- Wick-to-Body Ratio: The lower wick is at least twice the size of the real body. A longer lower wick suggests stronger selling pressure during the session. The small body near the top shows that buyers regained some ground, but the selling presence indicates possible exhaustion in the uptrend.
- Market Sentiment Shift: The Hanging Man shows a potential shift in sentiment. Buyers dominated the trend but struggled to hold higher prices. The presence of strong selling within the session raises doubts about the continuation of the uptrend. A bearish follow-up candle strengthens the possibility of a reversal.
- Confirmation Requirement: A Hanging Man alone is not enough to confirm a trend change. Traders wait for a bearish candle in the next session to confirm selling strength. If the price closes lower, it supports the pattern’s signal. Without confirmation, the trend may continue upward, making early trades risky.
- Volume Impact: Higher volume during a Hanging Man formation strengthens its reliability. Increased trading activity means more sellers participated, adding weight to the bearish signal. If volume is low, the pattern may not indicate strong selling pressure, reducing its significance for traders.
- Use in Trading Strategies: Traders use the Hanging Man as a warning rather than a direct sell signal. It is most effective when combined with resistance levels, technical indicators, and market trends. A strong confirmation candle helps traders decide whether to reduce long positions or prepare for a potential reversal.
Importance of Hanging Man Pattern
The key importance of the Hanging Man pattern is its role in signaling potential weakness in an uptrend. It warns traders that selling pressure is increasing despite buyers recovering lost ground. This helps traders assess market strength, manage risk, and exit or adjust their positions.
- Early Warning of Weakness: The Hanging Man alerts traders that an uptrend may be losing momentum. It forms when sellers push prices lower, but buyers manage a partial recovery. The presence of strong selling pressure within an uptrend signals that demand may be fading, increasing the risk of a potential trend reversal.
- Helps in Risk Management: Traders use the Hanging Man to adjust stop-loss levels and reduce exposure. If the pattern forms near a key resistance, it becomes a signal to tighten risk controls. This allows traders to protect their gains and avoid unnecessary losses if the market starts turning downward.
- Used for Identifying Exit Points: Investors holding long positions watch for Hanging Man formations near resistance levels. If the next candle confirms selling pressure, it signals that the trend may reverse. This helps traders decide whether to exit or take partial profits before the market moves against them.
- Supports Short-Selling Decisions: Traders looking for short-selling opportunities use the Hanging Man as an early signal. If a strong bearish candle follows, it confirms increased selling strength. This allows traders to enter short positions with well-defined stop-loss levels, improving risk-to-reward ratios in bearish market conditions.
- Confirmation Improves Accuracy: A Hanging Man alone does not confirm a trend reversal. Traders wait for the next candle to close lower before acting. This confirmation step reduces false signals and improves decision-making, ensuring traders do not exit or enter positions based solely on one candlestick formation.
- Works Best Near Resistance Levels: The Hanging Man gains more significance when it forms near-strong resistance. Resistance areas already indicate selling pressure. When combined with a Hanging Man, the probability of a reversal increases. Traders rely on this pattern to strengthen their market analysis before making decisions.
- Enhances Technical Analysis Strategies: Traders use the Hanging Man alongside indicators like RSI, MACD, and moving averages to confirm bearish signals. These additional tools help validate the pattern and ensure that decisions are based on multiple factors rather than relying on a single candlestick for market direction.
Shooting Star and Hanging Man Patterns – Quick Summary
- The main difference between a Shooting Star and a Hanging Man is their placement in a trend. A Shooting Star signals a potential reversal, while a Hanging Man suggests weakness in an ongoing uptrend. Both patterns indicate caution but serve different purposes in technical analysis.
- A Shooting Star pattern forms after an uptrend and signals a potential bearish reversal. It has a small body near the low, a long upper wick, and little to no lower wick, showing that buyers lost control and sellers took over by the close.
- A Hanging Man pattern appears after an uptrend and suggests possible weakness. It has a small body near the high, a long lower wick, and little to no upper wick. This shows that sellers attempted to push prices lower before buyers managed a partial recovery.
- The primary difference between these patterns is their role in price action. A Shooting Star shows strong rejection of higher prices, while a Hanging Man indicates selling pressure within an uptrend. Both patterns require confirmation from the next candle before traders take action.
- The Shooting Star pattern functions by forming after an uptrend, where buyers push prices higher, but strong selling pressure forces a close near the opening level. The long upper wick signals rejection of higher prices, making traders cautious about further upside movement.
- The Hanging Man pattern functions by forming after an uptrend, where sellers push prices lower but buyers recover before the close. The long lower wick shows that selling pressure exists within the trend, which could indicate potential weakness if confirmed by a bearish candle.
- The main characteristic of a Shooting Star is its small body and long upper wick. It appears after an uptrend, showing failed buying pressure. The wick-to-body ratio and its position near resistance determine its strength, with higher volume increasing reliability.
- The primary importance of a Shooting Star pattern is its ability to warn traders of a potential trend reversal. It helps in risk management, identifying exit points, and short-selling opportunities. Traders use it with resistance levels and confirmation signals to improve accuracy.
- The main characteristic of a Hanging Man pattern is its small body near the high and long lower wick. It appears after an uptrend, signaling that sellers attempted to push prices lower. The wick-to-body ratio and position near resistance affect its reliability.
- The key importance of a Hanging Man pattern is its role in identifying potential weakness in an uptrend. It helps traders manage risk, exit long positions, and find short-selling opportunities. Its reliability improves when combined with resistance levels and confirmation candles.
- Want to improve your technical analysis skills? Alice Blue Online offers advanced charting tools and market insights to help you trade with confidence. Start analyzing patterns like Shooting Star and Hanging Man today.

Shooting Star vs Hanging Man – FAQs
The fundamental difference between a Shooting Star and a Hanging Man is their indication within an uptrend. A Shooting Star signals a potential reversal, while a Hanging Man suggests weakness without confirming a bearish trend change.
A Shooting Star indicates that buyers pushed prices higher, but sellers took control before the close. This pattern signals potential trend reversal, especially if the next candle confirms bearish momentum.
The Hanging Man pattern is bearish when confirmed by a lower close in the next session. On its own, it only signals weakness in an uptrend but does not guarantee reversal.
A Shooting Star has a small body near the low, a long upper wick, and little or no lower wick. It appears after an uptrend and signals potential reversal when confirmed.
A Hanging Man pattern appears after an uptrend and signals potential weakness. It forms when sellers push prices lower, but buyers regain control before closing. Traders wait for bearish confirmation before considering it a reversal signal.
A Hanging Man itself is not bullish, but if the next candle closes higher, the uptrend may continue. Without confirmation, the pattern only suggests temporary selling pressure and does not guarantee a trend reversal. Confirmation is necessary for reliability.
Yes, both patterns can be used in intraday trading. Traders rely on confirmation candles, resistance levels, and volume to validate signals. Combining these patterns with indicators like RSI or MACD improves accuracy for short-term trading decisions.
If confirmed by a bearish candle, a Hanging Man signals a potential reversal. If the price continues to rise, the pattern remains invalid. Traders wait for confirmation before making trading decisions.
The Hanging Man pattern is reliable when it appears near resistance and is confirmed by a bearish close. High volume strengthens its signal, but traders should use additional indicators for confirmation.


