


Doji candlestick pattern represents market indecision, where opening and closing prices are nearly equal. It signals a potential trend reversal or continuation, depending on the context. Traders use Doji patterns with technical indicators to confirm entry and exit points in trading.
Content:
- Doji Candlestick Pattern Meaning
- Types of Doji Candlestick Patterns
- Doji Candlestick Pattern in Uptrend and Downtrend
- Doji Candlestick Pattern for Reversals and Continuations
- Advantages of Doji Candlestick Pattern
- Limitations of Doji Candlestick Pattern
- Doji Candlestick Candlestick Pattern vs Spinning Top Candlestick Pattern
- What Is the Doji Candlestick Pattern? – Quick Summary
- Doji Candlestick Pattern Meaning – FAQs
Doji Candlestick Pattern Meaning
Doji candlestick pattern occurs when a stock’s opening and closing prices are nearly identical, showing market indecision. It signals a potential trend reversal or continuation, depending on previous price action and supporting technical indicators.
A Doji forms when buyers and sellers are equally strong, preventing significant price movement. It appears in uptrends and downtrends, requiring confirmation through volume analysis or trend indicators before making a trading decision.
Traders use Doji patterns in combination with RSI, MACD, or Bollinger Bands to confirm trend reversals. A Doji followed by a strong bullish or bearish candle often confirms the next market direction.


Types of Doji Candlestick Patterns
The main types of Doji candlestick patterns include Standard Doji, Long-Legged Doji, Dragonfly Doji, Gravestone Doji and Four-Price Doji. Each variation signals market indecision, potential reversals, or trend continuation, depending on prior price action and confirmation from technical indicators.
- Standard Doji: Forms when opening and closing prices are nearly identical, indicating market indecision. Traders use it with trend confirmation indicators to determine whether a reversal or continuation is likely.
- Long-Legged Doji: Shows high volatility with long wicks on both sides, reflecting strong buying and selling pressure. It suggests uncertainty, requiring confirmation from subsequent candles for trend direction.
- Dragonfly Doji: Has a long lower shadow and no upper wick, signalling a bullish reversal when found in a downtrend. Buyers push prices higher, showing strong demand at lower levels.
- Gravestone Doji: Features a long upper shadow and no lower wick, indicating a bearish reversal. Found in uptrends, it signals strong selling pressure, suggesting a potential downward move.
- Four-Price Doji: Appears as a single horizontal line, showing no price movement between open, close, high and low. It represents extreme indecision or low trading volume, making it a rare and unreliable trading signal.
Doji Candlestick Pattern in Uptrend and Downtrend
Doji candlestick in an uptrend suggests buyer hesitation, indicating a possible trend reversal or continuation. In a downtrend, it signals seller exhaustion, often leading to a bullish reversal if confirmed by subsequent price action and technical indicators.
In an uptrend, a Doji after a strong rally shows uncertainty among buyers. If followed by a bearish candle, it confirms trend reversal, whereas a bullish candle continuation suggests the uptrend will persist.
In a downtrend, Doji suggests weakening selling pressure. If a bullish candle follows, it signals a reversal, while a bearish confirmation means the downtrend is likely to continue, requiring traders to watch for volume and support levels.
Doji Candlestick Pattern for Reversals and Continuations
Doji pattern can indicate both reversals and continuations, depending on previous price action. A reversal Doji appears at trend exhaustion, while a continuation Doji shows temporary consolidation before the trend resumes.
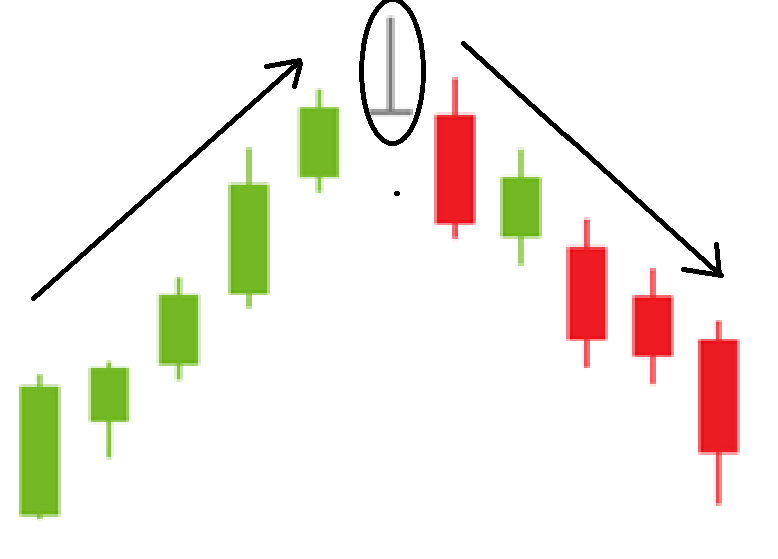
For reversals, a Doji at the peak of an uptrend signals buyer exhaustion, while in a downtrend, it signals seller weakness. Confirmation from a strong opposite-direction candle strengthens the reversal signal.
For continuations, a Doji within a trend reflects temporary consolidation, with the next candle deciding the direction. If followed by a trend-confirming candle, the movement continues, helping traders stay in profitable trades.
Advantages of Doji Candlestick Pattern
The main advantages of the Doji candlestick pattern include early trend reversal signals, improved trade timing, enhanced market sentiment analysis and confirmation of price indecision. Traders use Doji patterns with technical indicators to make informed entry and exit decisions for better trading accuracy.
- Early Trend Reversal Signals: A Doji at trend exhaustion signals potential reversals, helping traders identify turning points before price movements shift, reducing entry risks and improving trade accuracy when confirmed by subsequent candlestick patterns.
- Improved Trade Timing: The Doji pattern highlights market indecision, allowing traders to wait for confirmation before entering trades. This helps in avoiding impulsive decisions and improves timing for precise entries and exits.
- Enhanced Market Sentiment Analysis: A Doji indicates buyer-seller indecision, helping traders gauge sentiment shifts. When combined with volume and trend indicators, it provides valuable insights into market psychology.
- Confirmation of Price Indecision: Doji patterns confirm uncertain market conditions, prompting traders to avoid false breakouts. Monitoring Doji formations with support and resistance levels enhances decision-making for high-probability trades.
- Reliable in Multiple Timeframes: Doji patterns are effective in scalping, intraday and swing trading. Their presence in daily and weekly charts strengthens long-term trend signals, making them valuable across various trading strategies.
Limitations of Doji Candlestick Pattern
The main limitations of the Doji candlestick pattern include frequent false signals, lack of standalone reliability, dependence on confirmation and sensitivity to market noise. Traders must use additional indicators and trend analysis to avoid misinterpretation and inaccurate trade execution.
- Frequent False Signals: Doji patterns often appear without leading to actual reversals, causing traders to misinterpret market direction. Confirmation from subsequent candles and volume analysis is necessary for accurate trading decisions.
- Lack of Standalone Reliability: A Doji alone does not confirm a trend reversal. It must be analyzed with other indicators, such as moving averages or RSI, to validate potential market shifts.
- Dependence on Confirmation: Without strong follow-up candles, a Doji fails to provide a clear trade signal. Traders need bullish or bearish confirmation to execute trades effectively.
- Sensitivity to Market Noise: Doji patterns can form due to minor price fluctuations, especially in low-volume markets, making them less reliable in choppy trading conditions.
- Limited Effectiveness in Strong Trends: In high-momentum markets, a Doji may not indicate a reversal but rather a temporary consolidation, leading to missed opportunities if traders solely rely on it.
Doji Candlestick Candlestick Pattern vs Spinning Top Candlestick Pattern
The main difference between the Doji and Spinning Top candlestick patterns is body size and market sentiment. A Doji has nearly equal open and close prices, signalling indecision, while a Spinning Top has a small body, indicating weakened momentum with potential reversal.
| Aspect | Doji Candlestick Pattern | Spinning Top Candlestick Pattern |
| Body Size | Almost non-existent (open and close prices are nearly the same). | Small real body, indicating slight price movement. |
| Upper & Lower Wicks | Long or short wicks on both sides. | Long wicks on both sides, showing price fluctuations. |
| Market Sentiment | Indecision between buyers and sellers. | Weakening momentum, suggesting potential reversal. |
| Trend Implication | Signals uncertainty; needs confirmation for reversal or continuation. | Indicates buyers and sellers losing control, requiring trend confirmation. |
| Common Appearance | Found in uptrends, downtrends and consolidations. | Appears in reversal zones or during trend slowdowns. |
| Reliability | Needs strong confirmation from the next candle. | More reliable than Doji but still requires further confirmation. |
What Is the Doji Candlestick Pattern? – Quick Summary
- A Doji candlestick pattern indicates market indecision, where opening and closing prices are nearly equal. It signals potential trend reversals or continuations, requiring confirmation from technical indicators for effective trading decisions.
- The main types of Doji candlesticks are Standard, Long-Legged, Dragonfly, Gravestone and Four-Price Doji. Each type reflects market indecision and potential trend shifts, depending on price action and technical confirmation.
- In uptrends, a Doji suggests buyer hesitation, signalling potential reversals or continuation. Downtrends indicate seller exhaustion, often leading to bullish reversals if confirmed by price action and technical indicators.
- Doji patterns indicate trend reversals or continuations based on previous price action. A reversal of Doji signals exhaustion, while a continuation of Doji suggests consolidation before trend resumption, requiring confirmation from the next candle.
- The main advantages of Doji patterns include early reversal signals, improved trade timing, enhanced market sentiment analysis and confirmation of price indecision, aiding traders in making precise entry and exit decisions.
- The main limitations of Doji patterns are frequent false signals, low standalone reliability, dependence on confirmation and sensitivity to market noise, requiring additional indicators for accurate trade execution.
- The main difference between Doji and Spinning Top candlestick patterns is body size and sentiment. A Doji has nearly equal open-close prices, signalling indecision, while a Spinning Top has a small body, reflecting weakened momentum and possible reversals.
- Open a free demat account with Alice Blue in 15 minutes today! Invest in Stocks, Mutual Funds, Bonds & IPOs for Free. Also, trade at just ₹ 20/order brokerage on every order.

Doji Candlestick Pattern Meaning – FAQs
A Doji candlestick pattern occurs when a stock’s opening and closing prices are nearly equal, signalling market indecision. It suggests a potential reversal or continuation, depending on the previous trend and confirmation from technical indicators.
A Doji has a small or no real body with upper and lower wicks, where the open and close prices are nearly identical. It appears after strong trends, indicating buyer-seller indecision and requiring confirmation for trade decisions.
A Doji indicates market uncertainty and a potential trend reversal or continuation. It forms when buyers and sellers balance, suggesting traders should wait for a confirmation candle before making trading decisions.
A Doji is moderately reliable and should not be traded alone. Its accuracy improves when combined with indicators like RSI, MACD, or Bollinger Bands, confirming whether the market will reverse or continue trending.
A Doji has no real body, indicating complete indecision, while a Spinning Top has a small body, suggesting weakened momentum. Both require confirmation from subsequent candles to determine market direction.
Traders should wait for confirmation from the next candle. A bullish candle after a Doji in a downtrend signals a buying opportunity, while a bearish candle after a Doji in an uptrend suggests selling.
No, a Doji can indicate either a reversal or continuation, depending on its position within the trend. Confirmation through trendlines, volume and technical indicators is essential before taking a trading position.
Doji patterns work well in short-term (15-minute, 1-hour) and long-term (daily, weekly) timeframes. Intraday traders use them for quick scalping, while swing traders look for reversals or trend continuations.
Yes, Doji patterns are widely used in forex and crypto markets, where high volatility creates indecision. They work best when combined with support/resistance levels, trend analysis and volume confirmation.
Confirm a Doji’s signal with trendlines, moving averages, RSI, MACD, or Bollinger Bands. A bullish Doji followed by a strong green candle confirms reversal, while a bearish Doji with selling pressure confirms trend continuation.
Disclaimer: The above article is written for educational purposes and the companies’ data mentioned in the article may change with respect to time. The securities quoted are exemplary and are not recommendatory.


