


The Three Black Crows candlestick pattern is a bearish reversal signal consisting of three consecutive long red candles. It indicates strong selling pressure after an uptrend, suggesting a potential downtrend as bearish momentum gains strength, confirming market weakness.
Content:
- Three Black Crows Candlestick Pattern Meaning
- How to Identify the Three Black Crows Candlestick Pattern?
- Three Black Crows Candlestick Pattern Formation and Structure
- Three Black Crows Candlestick Pattern in Uptrend and Downtrend
- Three Black Crows Candlestick Pattern for Reversals and Continuations
- Three Black Crows Candlestick Pattern vs Other Bearish Patterns
- Advantages of The Three Black Crows Candlestick Pattern
- Limitations of Three Black Crows Candlestick Pattern
- What Is the Three Black Crows Candlestick Pattern? – Quick Summary
- Three Black Crows Candlestick Pattern Meaning – FAQs
Three Black Crows Candlestick Pattern Meaning
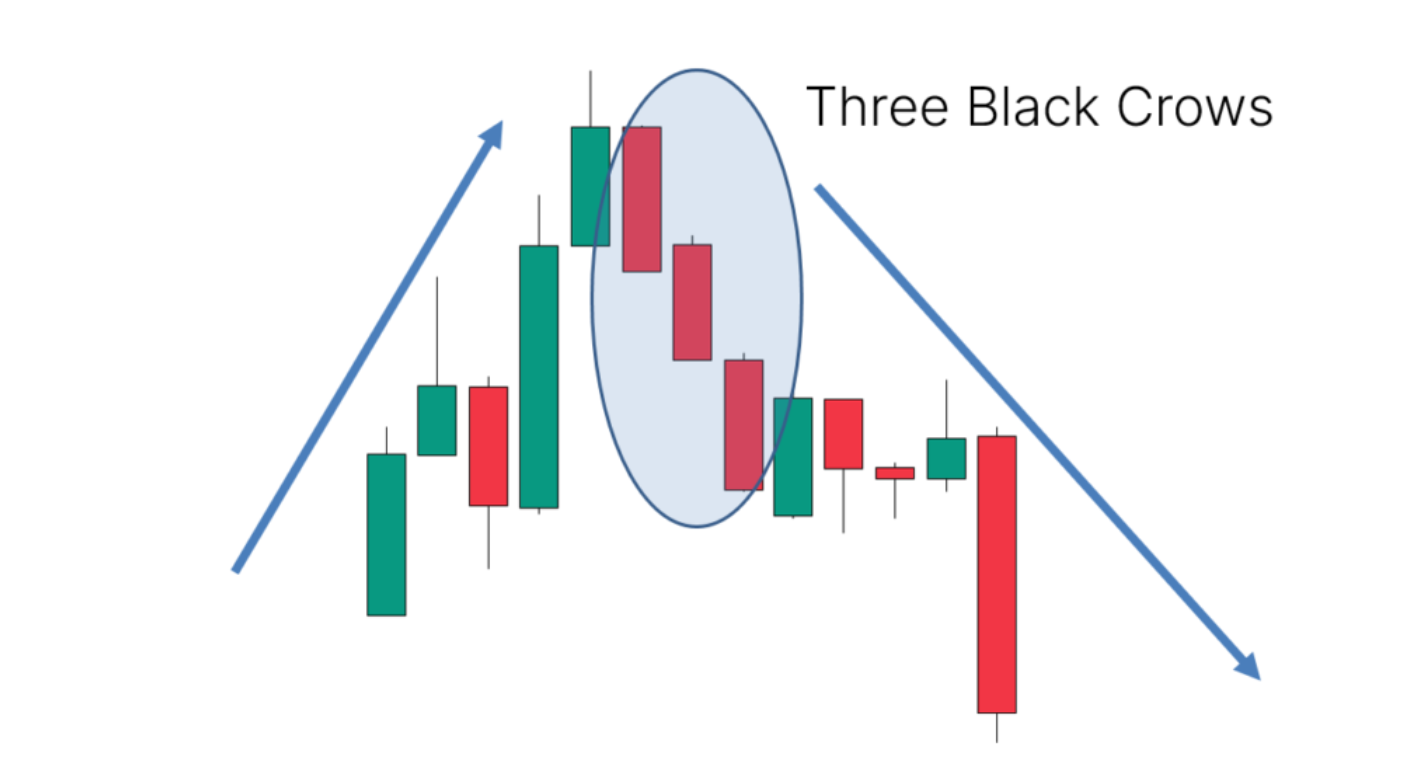
The Three Black Crows candlestick pattern is a bearish reversal signal that appears after an uptrend, indicating a shift in market sentiment. It consists of three consecutive long red candles, each opening within the previous candle’s body and closing lower.
This pattern forms when bears overpower bulls in three consecutive sessions, creating a strong downward movement. The lack of significant wicks suggests sustained selling pressure, reinforcing the possibility of a trend reversal as buyers struggle to regain control.
Traders often use the Three Black Crows pattern alongside technical indicators like RSI, moving averages, or support levels to confirm bearish momentum. While it signals potential weakness, additional analysis is necessary to avoid false breakouts and ensure reliable trading decisions.

How to Identify the Three Black Crows Candlestick Pattern?
Identifying the Three Black Crows candlestick pattern involves spotting three consecutive long red candles forming after an uptrend. Each candle should open within the previous candle’s body and close lower, indicating increasing selling pressure and a potential bearish reversal in the market.
The candles should have minimal or no wicks, reflecting strong bearish momentum with little to no buying interest. The pattern is more reliable when accompanied by high trading volume, confirming that sellers are in control and pushing prices downward consistently.
To enhance accuracy, traders should confirm the pattern with technical indicators like RSI, moving averages, or support levels. If the market is already oversold, the pattern may lead to consolidation rather than a strong downtrend, requiring further validation.
Three Black Crows Candlestick Pattern Formation and Structure
The Three Black Crows pattern forms after an uptrend, signalling a bearish reversal. It consists of three consecutive long red candles, each opening within the previous candle’s body and closing lower, indicating increasing selling pressure and a shift in market sentiment.
The structure of this pattern shows minimal or no wicks, reflecting strong bearish momentum and limited buyer intervention. Each session starts with slight optimism but quickly faces downward pressure, closing near the session’s low. This sustained decline reinforces bearish dominance in the market.
For confirmation, traders analyze volume trends and technical indicators like RSI and moving averages. A high-volume formation strengthens reliability, whereas oversold conditions may indicate consolidation instead of a strong downtrend, requiring careful assessment before making trading decisions.
Three Black Crows Candlestick Pattern in Uptrend and Downtrend
In an uptrend, the Three Black Crows pattern signals a potential bearish reversal. It forms when three consecutive long red candles appear after a strong rally, indicating that selling pressure is overtaking bullish momentum. This suggests a weakening trend and possible price decline.
In a downtrend, the Three Black Crows pattern reinforces existing bearish sentiment. If it appears after a slight pullback or consolidation, it confirms continued selling pressure, pushing prices lower. Traders often use this pattern to identify further downside potential in an already weak market.
To avoid false signals, traders should confirm the pattern with indicators like RSI, MACD, or support levels. A high-volume formation strengthens its reliability, while an oversold market may lead to temporary consolidation instead of a prolonged decline.
Three Black Crows Candlestick Pattern for Reversals and Continuations
The Three Black Crows pattern is primarily a bearish reversal signal, appearing after an uptrend. It indicates that selling pressure is increasing, weakening bullish momentum. Traders interpret this as a potential trend change, signalling opportunities for short positions or exiting long trades.
In some cases, the pattern can also act as a continuation signal in a downtrend. If it forms after a brief pullback or consolidation, it confirms ongoing bearish sentiment, suggesting further price declines. This helps traders identify potential entry points in a sustained downtrend.
To improve accuracy, traders use indicators like RSI, MACD and moving averages for confirmation. High volume strengthens reliability, while oversold conditions may lead to temporary consolidation instead of an immediate price drop, requiring careful trade assessment.
Three Black Crows Candlestick Pattern vs Other Bearish Patterns
The main difference between the Three Black Crows and other bearish patterns lies in its distinct three-candle structure. Unlike single or double-candle bearish patterns, it signals sustained selling pressure over three sessions, making it a stronger indicator of potential trend reversal.
| Pattern | Structure | Signal Strength | Market Context |
| Three Black Crows | Three consecutive long red candles with minimal wicks | Strong bearish reversal signal | Appears after an uptrend,signallingg trend exhaustion |
| Bearish Engulfing | A large red candle fully engulfs the previous green candle | Moderate bearish reversal signal | Forms after an uptrend, showing sudden bearish dominance |
| Evening Star | Three-candle pattern with a small-bodied middle candle | Strong bearish reversal signal | Indicates a shift from bullish to bearish sentiment after an uptrend |
| Hanging Man | A single candle with a small body and long lower wick | Weak to moderate reversal signal | Appears after an uptrend but requires confirmation for reliability |
Advantages of The Three Black Crows Candlestick Pattern
The main advantage of the Three Black Crows pattern is its strong bearish reversal signal. Unlike single-candle patterns, it provides a clearer indication of sustained selling pressure, helping traders identify potential downtrends and adjust their positions accordingly for better risk management.
- Clear Trend Reversal Signal: The pattern consists of three consecutive red candles, confirming a shift from bullish to bearish sentiment. This sustained decline makes it a more reliable indicator of a potential trend reversal compared to single or two-candle patterns.
- Helps in Identifying Strong Selling Pressure: Since each candle opens within the previous one’s body and closes lower, it indicates strong selling pressure. This helps traders gauge market sentiment and anticipate further downside movement, especially when supported by volume analysis.
- Provides Trading Opportunities: Traders can use this pattern to enter short positions, exit long trades, or adjust strategies accordingly. When combined with other technical indicators like RSI or moving averages, it improves decision-making and enhances the accuracy of trade setups.
- Works Across Different Timeframes: The Three Black Crows pattern is effective in multiple timeframes, from intraday to long-term charts. Swing traders, day traders and investors can leverage its signals to spot potential bearish trends and optimize their trading strategies accordingly.
Limitations of Three Black Crows Candlestick Pattern
The main limitation of the Three Black Crows pattern is that it can sometimes generate false signals, especially in oversold conditions. While it indicates bearish momentum, traders must confirm it with technical indicators to avoid misleading interpretations and prevent unnecessary trading risks.
- May Occur in Oversold Markets: If the pattern forms when the market is already oversold, further downside movement may be limited. Instead of a strong downtrend, the price may consolidate or even reverse, leading to potential false signals.
- Requires Confirmation for Accuracy: Relying solely on the pattern can be risky. Traders need to use additional indicators like RSI, MACD, or volume analysis to validate the signal and avoid mistaking temporary pullbacks for full-trend reversals.
- Not Always Reliable in Low Liquidity Markets: In stocks or assets with low liquidity, the pattern may form due to random price fluctuations rather than genuine selling pressure. This can reduce its effectiveness and increase the chances of misinterpretation.
- Potential for Short-term Retracements: Even in a strong downtrend, prices may briefly retrace or consolidate after the pattern appears. Traders must be cautious about entering positions without considering key support levels and overall market conditions.
What Is the Three Black Crows Candlestick Pattern? – Quick Summary
- The Three Black Crows pattern signals a bearish reversal with three consecutive red candles. It indicates strong selling pressure, requiring confirmation with technical indicators to avoid false signals and ensure reliable trading decisions.
- The Three Black Crows pattern features three long red candles after an uptrend, signalling bearish momentum. Minimal wicks and high volume strengthen reliability, but traders should confirm with technical indicators to avoid false signals.
- The Three Black Crows pattern signals a bearish reversal with three red candles, minimal wicks and strong selling pressure. Traders confirm with volume and indicators like RSI to ensure reliability and avoid false signals.
- The Three Black Crows pattern signals a bearish reversal in an uptrend and confirms selling pressure in a downtrend. Traders use volume and indicators like RSI to validate its reliability and avoid false signals.
- The Three Black Crows pattern signals a bearish reversal after an uptrend and confirms a downtrend continuation. Traders use indicators like RSI and MACD for confirmation to avoid false signals and improve trade accuracy.
- The Three Black Crows pattern stands out with three consecutive red candles, signalling strong bearish momentum. Compared to other bearish patterns, it provides a more sustained indication of a trend reversal, requiring confirmation for reliability.
- The Three Black Crows pattern signals strong bearish reversals, helps identify selling pressure, provides trading opportunities and works across timeframes. Traders use it with indicators like RSI for better accuracy and risk management.
- The Three Black Crows pattern may generate false signals, especially in oversold or low-liquidity markets. Traders should confirm it with indicators like RSI and MACD to avoid misinterpretation and short-term retracements.

Three Black Crows Candlestick Pattern Meaning – FAQs
The Three Black Crows is a bearish reversal pattern consisting of three consecutive long red candles with lower closes. It signals strong selling pressure after an uptrend, suggesting a potential trend reversal and increased bearish momentum in the market.
Traders use the Three Black Crows pattern to identify bearish reversals. It’s best confirmed with technical indicators like RSI or volume analysis. Entering short positions after confirmation, setting stop-loss above the pattern and monitoring market trends can enhance trade accuracy.
To identify this pattern, look for three consecutive bearish candles with long bodies and minimal wicks, forming after an uptrend. Each candle should open within the previous candle’s body and close lower, reflecting increasing bearish pressure and possible trend reversal.
This pattern indicates a shift from bullish to bearish sentiment, suggesting potential price declines. It shows that sellers are in control, overpowering buyers and increasing the likelihood of further downside movement, especially when confirmed by other technical indicators.
The reliability of the Three Black Crows pattern depends on market conditions and confirmation signals. While it strongly suggests bearish momentum, false signals can occur, making it essential to use volume analysis, RSI divergence, or support/resistance levels for validation.
The Three Black Crows candlestick pattern is bearish. It forms after an uptrend and consists of three long red candles, signalling strong selling pressure and a potential downtrend. Traders use it as a warning sign of weakening bullish momentum.
To trade this pattern, confirm it with technical indicators like RSI or MACD. Enter short positions after a minor pullback, set stop-loss above the pattern’s high and target key support levels. Avoid trading in oversold conditions or against the primary trend.
No, the Three Black Crows pattern doesn’t always confirm a trend reversal. It requires validation through volume, support levels, or indicators like RSI. If found in an oversold market, it may signal temporary consolidation rather than a strong downtrend.
The best timeframe depends on the trading style. For intraday traders, the 15-minute to 1-hour chart works well. Swing traders prefer daily charts, while long-term investors look for confirmations on weekly charts for stronger trend reversals.
Confirm signals using volume analysis, RSI divergence and key support levels. High selling volume strengthens its reliability. Additional bearish indicators, such as moving average crossovers or bearish MACD signals, enhance confidence in the pattern’s effectiveness.
Disclaimer: The above article is written for educational purposes and the companies’ data mentioned in the article may change with respect to time. The securities quoted are exemplary and are not recommendatory.


